Monitoring Palo Alto Firewalls using API
A Guide to Monitor the Status of Your IPSec Tunnels with Python and API integration.

When it comes to networking monitoring, SNMP is by far one of the most used protocols. It is easy to have visibility over traffic and interface’s status polling network-related OIDs from SNMP database. However, not all vendors make it available to monitor virtual interfaces (such as IPSec) the same way as they do with physical ones. Palo Alto is one of these. If you check their documentation (linked here) it will tell you that the IPSec tunnel status is monitored only via SNMP traps and not queries.
So, in this post I will address how to monitor IPSec tunnel status using API instead of SNMP, when the latter is not an option.
To work around this, I developed a script in Python that leverages the Palo Alto API to retrieve IPSec tunnel status. While this script was primarily designed for Zabbix, it can easily be adapted for other monitoring tools. If you’re interested in dynamic monitoring approaches like Low-Level-Discovery (LLD), I recommend checking my previous posts for more details.
Why Can’t We Use SNMP in This Case?
SNMP works by querying a hierarchical tree of information that the device’s OS continuously updates. Monitoring tools like Zabbix or Prometheus collect this data periodically. For example, we can list all interfaces of a device using the following command (assuming you’re using the default publicSNMP community):
1
snmpwalk -v 2c public 1.2.3.4 ifname
That would return a list of all interfaces, including tunnel interfaces:
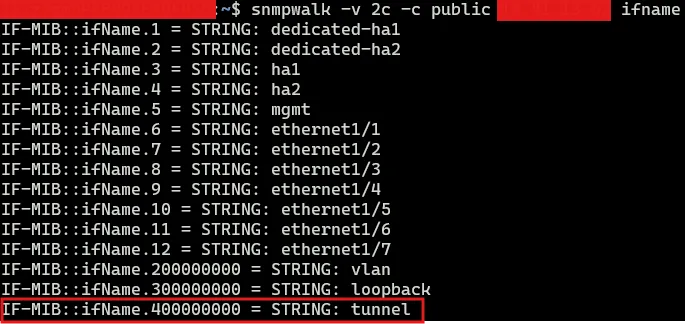 Default interface list on Palo Alto Firewalls
While SNMP retrieves tunnel interfaces listed in the GUI under Network > Interface > Tunnel, it does not monitor IPSec Tunnels located under Network > IPSec Tunnels, and here lies the critical issue:
- Tunnel interfaces are virtual and do not reflect the real status of the IPSec tunnel. Even if the IPSec tunnel goes down, the associated tunnel interface will still appear as operational.
Demonstrating the problem
For the purpose of this post I created a fake IPSec tunnel called Medium and linked it to the tunnel.1 interface
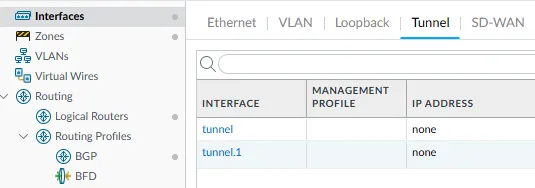 List of tunnel interfaces
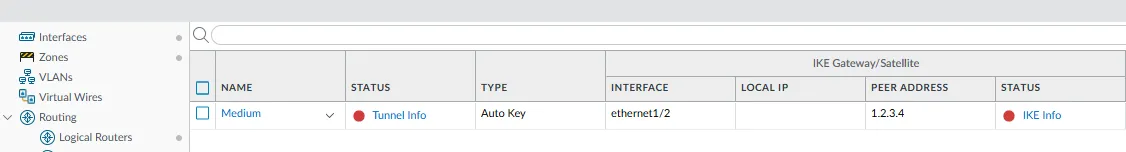 List of IPSec tunnels
If we list the interfaces again, you will see that the MediumIPSec interface is not listed, which is not the case of the listed tunnel.1 interface. By default, SNMP puts an indexer number after the interface’s name. This number is incremented each time a new interface is created.
1
snmpwalk -v 2c -c public 1.2.3.4 ifname
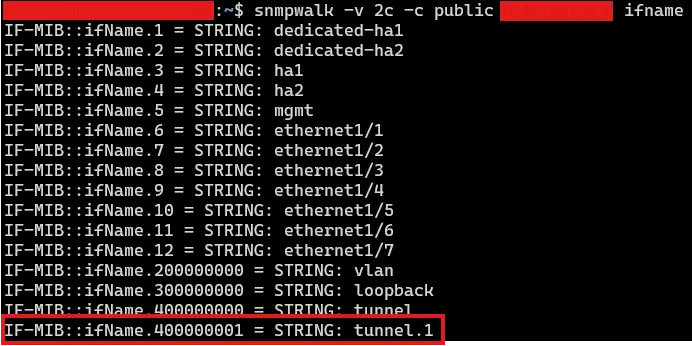 Interface list with tunnel.1
If we use SNMP to query the operational status of the tunnel.1 interface, it will incorrectly show “up”, even though the GUI clearly indicates the tunnel is down (via the red status icon).
1
snmpwalk -v 2c -c public 1.2.3.4 IF-MIB::ifOperStatus.400000001
 tunnel.1 operational status
Result
The SNMP response still reports the tunnel as operational.
How do we solve that?
As said above, I developed a Python script that consumes the firewall’s API to retrieve the precise tunnel status. The script supports two main actions:
- Discovery: Outputs all tunnels in JSON format, ideal for Zabbix’s Low-Level Discovery (LLD).
- Status: Returns a numeric status of a specific tunnel. You can find and download the script here. Below are examples of how to use it:
a) Discovery Mode
The discovery action lists all tunnels in JSON format:
1
script.py 1.2.3.4 username password discovery
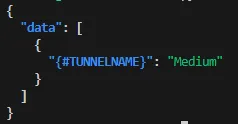 Discovery output
This JSON output is very powerful for tool like Zabbix to create dynamic monitoring items through LLD. If I had more than one interfaces, it would output something like this:
1
2
3
4
5
6
7
{
 "data": [
 {"{#TUNNELNAME}": "Tunnel1"},
 {"{#TUNNELNAME}": "Medium"},
 {"{#TUNNELNAME}": "BackupTunnel"}
 ]
}
b) Status Mode
To check the status of a specific tunnel, use the status action:
1
script.py 1.2.3.4 username password status 'Medium'
 Tunnel status
The possible outputs are:
1- Tunnel is up2- Tunnel is down
Integrating the Script with Zabbix
You can easily integrate the script into your monitoring workflow. For Zabbix, here’s a single outline:
- Discovery Integration: use the discovery action to create dynamic tunnel items using LLD.
- Status Monitoring: regularly query tunnel status using the status action.
- Trigger Alerts: set up triggers to alert you if any tunnel goes down.
Conclusion
By leveraging Palo Alto’s API, you an go around the limitations of SNMP queries and improve the visibility of your IPSec tunnels. This approach can be extended to other scenarios where the information you need available via API only.
I hope you find this solution helpful for your monitoring setup. If you have questions or suggestions, feel free to share them in the comments. Cheers!