Monitoring Cluster Shared Volumes with Zabbix
How to monitor your cluster disks in Zabbix
In this post, we’ll see how to monitor Microsoft’s failover cluster disks using Zabbix’s LLD. If you have no idea what a failover cluster is, I suggest you check here.
Generally, the disks made available to a cluster have an “owner.” This means that the property of reading and writing to that disk belongs to a cluster node, and only to it. With CSV (Cluster Shared Volumes, and not Comma Separated List ;)), it is possible to have more than one node writing to the same volume simultaneously. This also makes the failover process faster since there is no need to unmount and then remount the volume if ownership changes. More information about CSV can be found here.
One of the “problems” with using CSV is that the cluster simply consumes the volume and places it in a folder inside C:\ClusterStorage\VolumeX, with X being incremented as new disks are added as CSVs.
Considering that we can no longer monitor the disks natively in Zabbix using the default Zabbix keys (since the disks don’t exist in the same way!), the only option left is to develop a script to collect this data dynamically through LLD. If you don’t know what LLD is, I suggest you take a look at my previous post where I explain what it is and how to create your own discovery process.
You can download the script (as well as the Zabbix template) that I created here. After downloading it, save it in a folder of your choice. For this script, you should save the file on the server to be monitored.
1) Testing the script
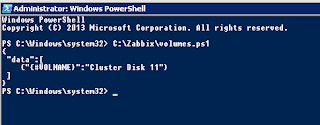
Most of the scripts I develop to perform LLDs work by executing them without any parameters. When executed this way, the script will list all the CSV disks in your cluster and format the output in JSON, using the macro {#VOLNAME} for each discovered disk. It is based on this macro’s value that the disk name will be added to the monitoring item and used for data collection.
To start, run C:\path\to\the\script\MonitorCSV.ps1
In the output, we can see that the script has found only one disk added to the cluster in CSV mode.
The script accepts 4 arguments: used, free, pfree, and total. For example, if you want to know the total size of disk 11, run the command below:
1
C:\path\to\the\script\MonitorCSV.ps1 "Cluster Disk11" total
2) Adding the script to Zabbix
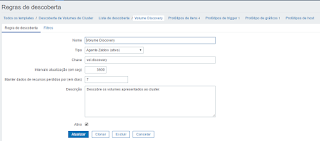
I’ve made a monitoring template available here. However, below are the steps to create the discovery rule:
a) First, create a new discovery rule that will consume the data generated in the JSON output. This will periodically process all available volumes. If a new one is found, items will also be created for this new volume.
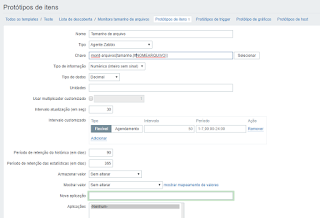
b) Now, create the items. Below are the details for each item I created. The LLD will dynamically create new items for each discovered volume.
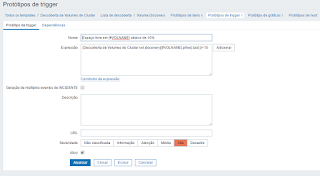
c) After that, create the trigger prototypes and graphs. All these elements will be dynamically created for each disk added to the cluster.
I hope this is helpfull. Enjoy!


